Get away!I don't agree with that.
There are lots of excess deaths compared with the last five years average but hardly any compared with 2018.
Discuss.
Get away!I don't agree with that.
The chart shows the excess deaths - in percentages - of each year compared with the previous five years average.do you mean "as shown on Trazor's chart?"
Meaningless figures.
Not sure; it might be less than 2018.You mean "higher than even the highest of any recent year" is meaningless?
The chart shows the excess deaths - in percentages - of each year compared with the previous five years average.
Example:
Previous five years deaths
1, 4, 2, 5, 3
this year 6
excess compared to average of previous five years (and last year)
increase 100%
excess compared with two years ago (5)
20%
Meaningless figures.
It is NOT a total number nor the total number killed in the war.What is it about the fact, that we are just short of the total number of WW11 deaths, this year, that does not perturb you.
The chart shows the excess deaths - in percentages - of each year compared with the previous five years average.
Example:
Previous five years deaths
1, 4, 2, 5, 3
this year 6
excess compared to average of previous five years (and last year)
increase 100%
excess compared with two years ago (5)
20%
Meaningless figures.
Get away!
There are lots of excess deaths compared with the last five years average but hardly any compared with 2018.
Discuss.

Well, I can't because I don't know which is correct.I wonder if EFLImpudence can show there is something wrong with this story:
"The Covid pandemic has caused excess deaths to rise to their highest level in the UK since World War Two.
That is a higher number than I have seen elsewhere and it does not match the figures from StatistaThere were close to 697,000 deaths in 2020 - nearly 85,000 more than would be expected based on the average in the previous five years.
If 85,000 is 14% of the expected figure, then the expected figure must be 607,000.This represents an increase of 14% - making it the largest rise in excess deaths for more than 75 years.
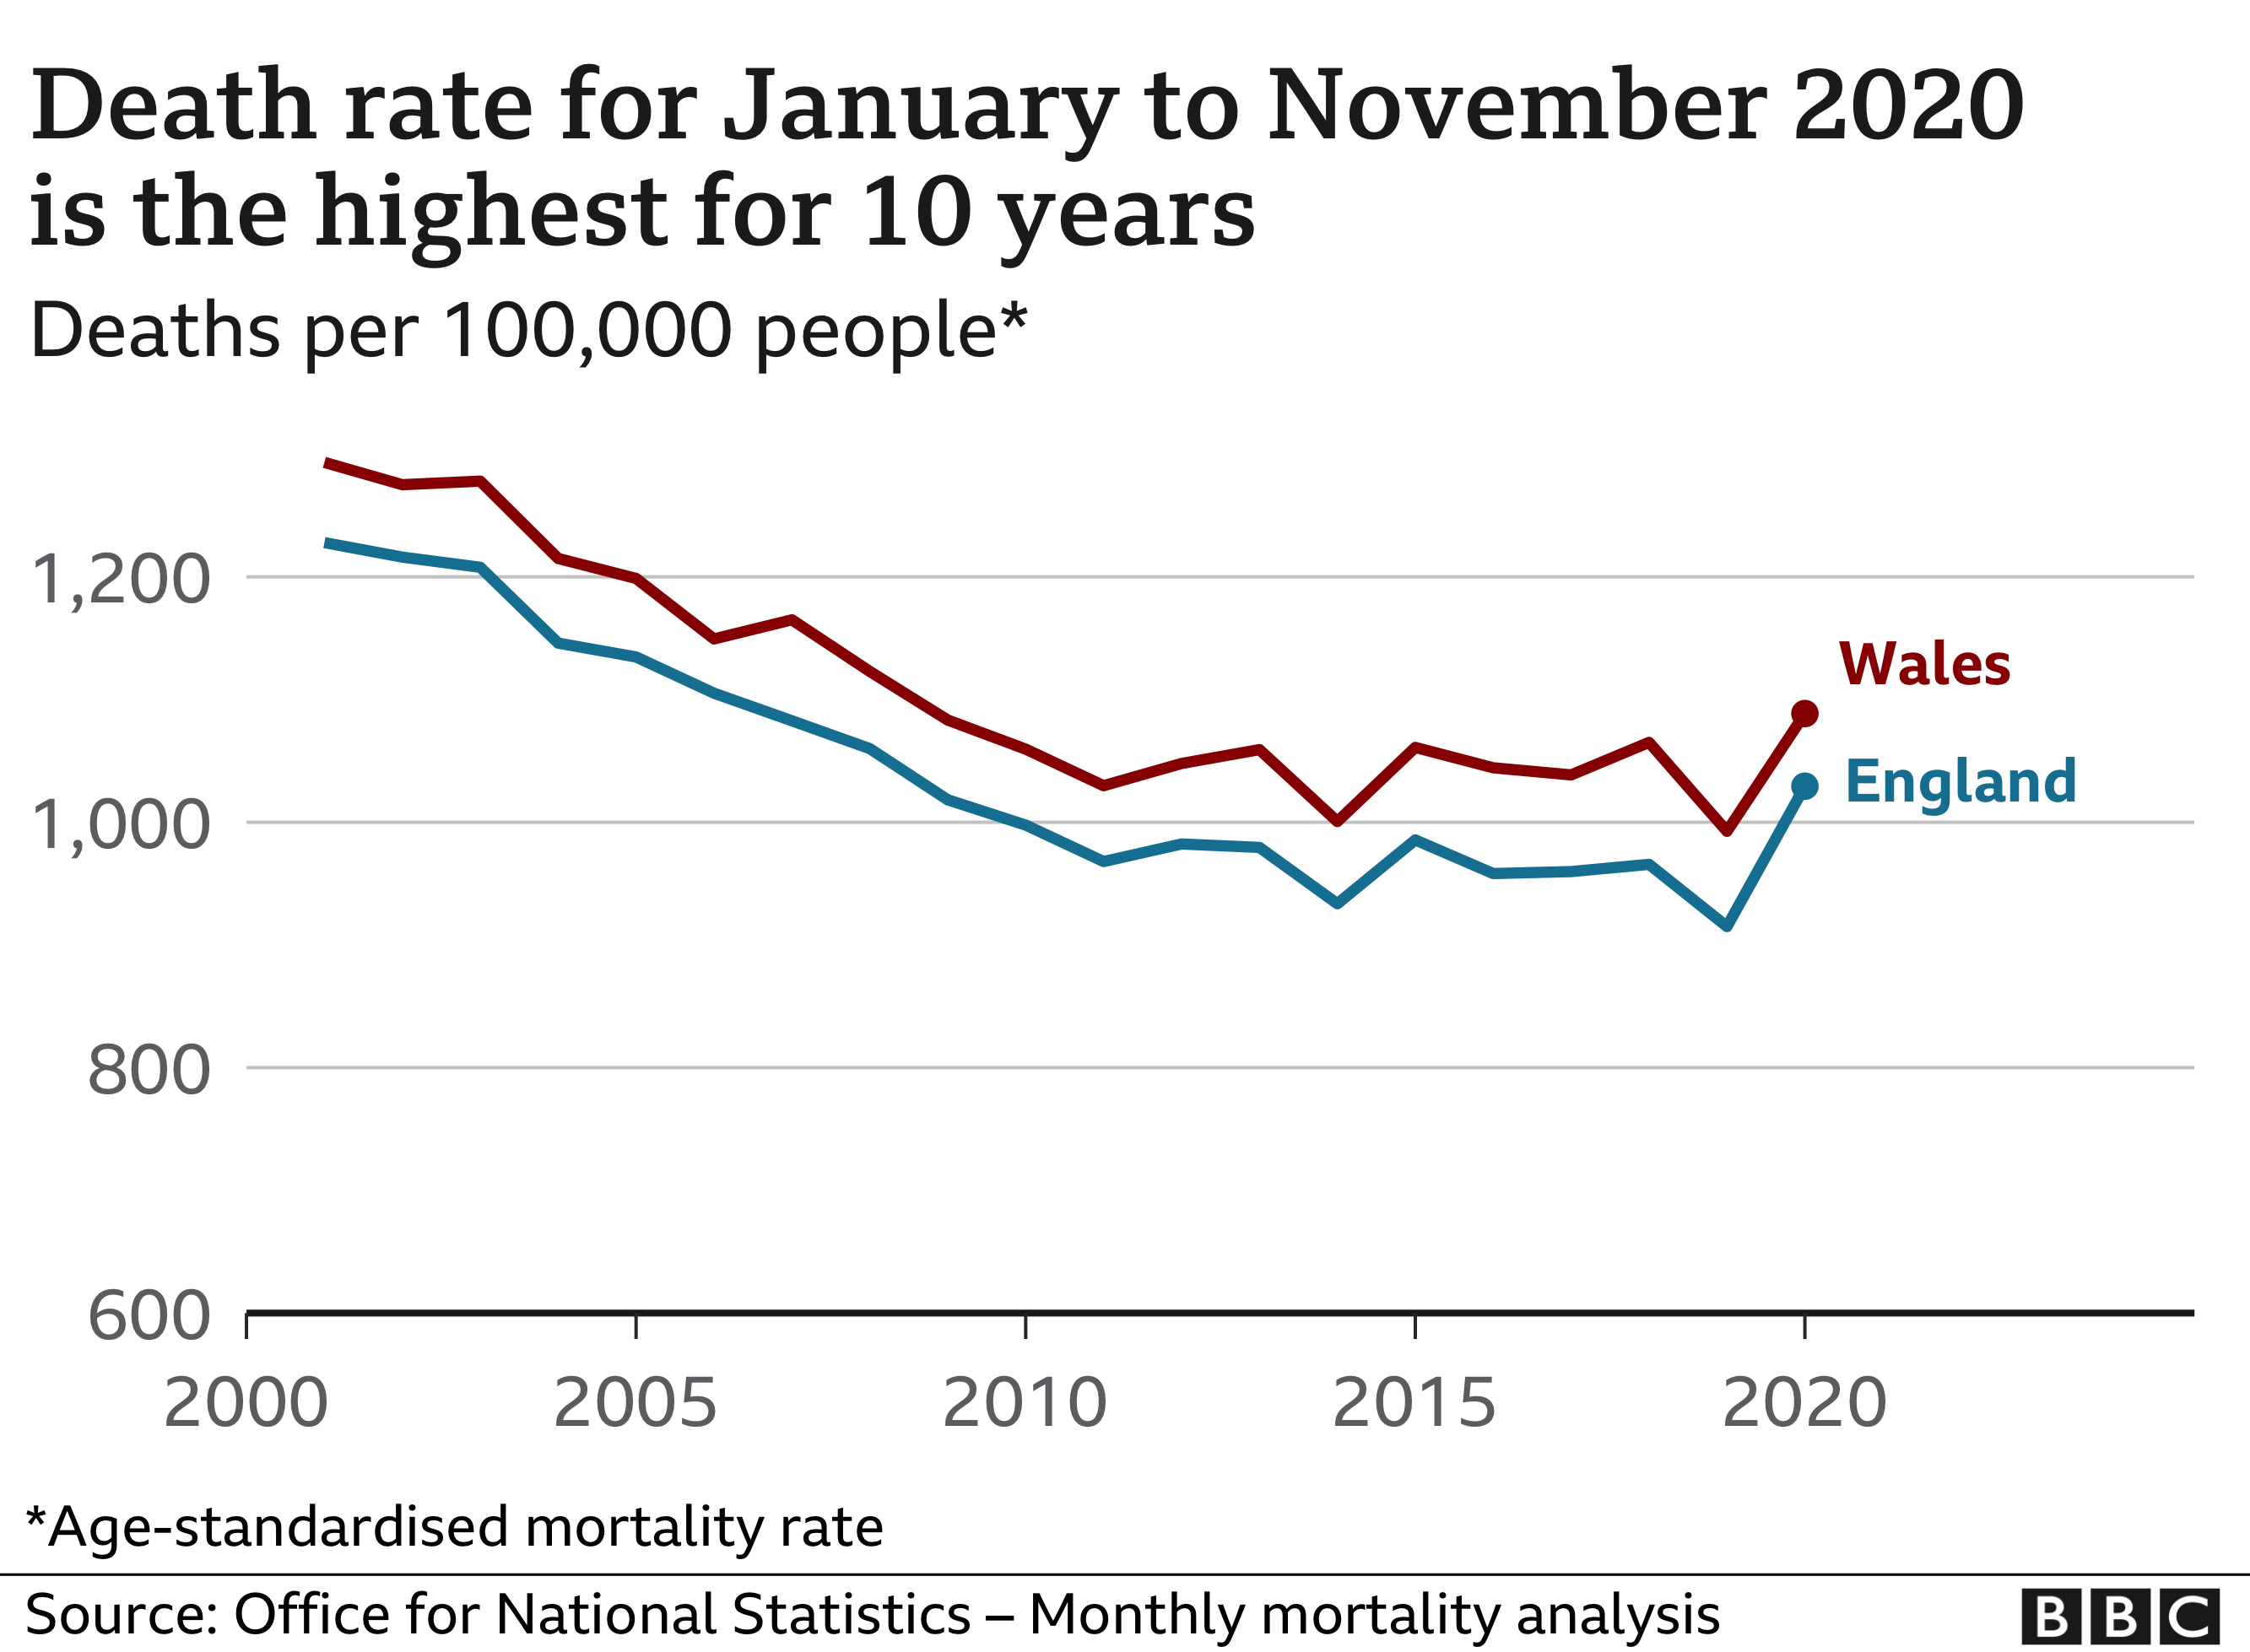
When the age and size of the population is taken into account, 2020 saw the worst death rates since the 2000s.
This measure - known as age-standardised mortality - takes into account population growth and age.
So the numbers are even higher.The data is only available until November - so the impact of deaths in December have not yet been taken into account - but it shows the death rate at that stage was at its highest in England since 2008."

Well, it has more deaths so it would."King's Fund chief executive Richard Murray said the picture was likely to worsen, given Covid deaths were rising following the surge in infections over recent weeks.
"The UK has one of the highest rates of excess deaths in the world, with more excess deaths per million people than most other European countries or the US," he said."

You b!tch...you told me I was your one and only.We'll need to be discreet.
