Meter puzzle

@Murdochcat It's higher than the estimates that I got by filling in a few wizards. These don't ask many questions and probably return a median value from a broad distribution - so much depends on what people are doing with the appliances. So yes, whether it's high or not is a moot point.

@flameport Thanks for the video - I'll check it out.
 
Sponsored Links
You need to take readings every week for a couple of months to see what you are actually using on a weekly basis AND if you go away for a few days take readings before you go and immediately you get back as that will give you a better idea of your background usage
 
Sponsored Links
And old fridges and freezers consume far more electricity than people realise
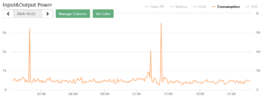
I was surprised how much more the upright uses to my chest freezer, this is why the picture shows so much for August, the monitor was on the upright freezer back then.

My background use is 300 to 500 watt, and my chest freezer uses 63 watt, about 1/3 on and 2/3 off, the upright a bit more, so can account for around 150 watt average with freezers, so say 50 watt for lights, that is still around 150-200 watt I can't account for, this PC must use some, and all the equipment on standby, I know the old Sky box used around 18 watt on standby to power the LNB.

I am not really worried, battery SOC is over 60%, and it is 11 pm, a lot better than normal, likely because did not watch TV tonight.

I clearly don't want to throw money away, but there is a limit to saving electric, as to smart meter, my meter is in the old garage, now a flat, so reading it on a regular basis is not going to happen. And the "In home display" all day it flits from a few watts import or a few watts export, it does not help one iota to work out what uses what.

The solar software shows what I use 1729634520776.pngyou can see each cup of coffee I have made for self and wife, but if you think I am going to stop drinking coffee to save on electric you're in cloud-cuckoo-land.
 
Here is what the video posted by @flameport shows. The left hand red digit tracks usage in units of kWh. From 0 to 1 units usage, the white units digit is in sync with the red digit. After 1 unit has been used, the white units digit stops for 1 unit's usage, so that at 3 units usage it displays 2. It then continues to lag actual usage by 1 unit until 10 units have been used, when it is fully showing 9. Then it jumps to 0, reconciling the lag, and starts again.

The reason for this mechanism is to avoid a gradual change from 9 to 0, so avoiding those digits being confused when the meter is read.

The video here also shows the operation of the meter, and how to read it.
 
Last edited:
The left hand red digit tracks usage in units of kWh. From 0 to 1 units usage, the white units digit is in sync with the red digit. After 1 unit has been used, the white units digits stops for 1 unit's usage, so that at 3 units usage it displays 2. It then continues to lag actual usage by 1 unit until 10 units have been used, when it is fully showing 9. Then it jumps to 0, reconciling the lag, and starts again.

The reason for this mechanism is to avoid a gradual change from 9 to 0, so avoiding those digits being confused when the meter is read.
Sooooo - there is really no need for there to be any numbers on that wheel.
 
That was my reaction too. I guess taking the wheel out would leave the potential for 0-9 confusion that the manufacturers wanted to avoid.
 

DIYnot Local

Staff member

If you need to find a tradesperson to get your job done, please try our local search below, or if you are doing it yourself you can find suppliers local to you.

Select the supplier or trade you require, enter your location to begin your search.


Are you a trade or supplier? You can create your listing free at DIYnot Local

 
Sponsored Links
Back
Top