Stock market dealing

What a dismal pursuit this is.
'Tis when you're losing.
I haven't time to check, but I bet you didn't wait for entries.....
.
Yes TTV is good if you can translate them into English, and not hear all the BS.
I've taken to watchin g CNBC & Bloombergin the am, they stick financial headlines up and mention important companies etc.
Not always but usually, SC's main idea or two turns out about right, more or less. Just making that trade, is fairly safe. He should do horoscopes - they're all right , after the event, if you interpret them his way.
I've just moved some Isas to T212 so will let them sit at 5.5%, until there's a particularly safe call, then go big. It can use those leveraged instruments. I used a couple of the Short ones today, but closed out by 4:30.
Crazy day today, probably the start of the predicted selloff. They usually start off in the highes excitement stocks, apparently.
I'm already out of most of the tech stocks, but will hold what's left because they should recover faster.
Do you have long-term holdings? I've adopted some "high yield" bonds - ie "junk" bonds. They pay around 12-16% pa. Theoretically if there were mass bankruptcies they could fail, but it hasn't happened for a v long time outside the USA.
Do you have any good ones?
I came across this late inthe day, about 7pm, where the line is.
1720731813289.png

Look it up . I thought it was an index of some sort but no. I wasn't holding anything so put 30k of isa on it. It's up 0.8%, 240 quid in the 4 hours - should be more in the morning. If you just want steady/ modest growth it looks handy. Look at the past.
I'm just going to check the stops...


Later in the day the stocks were fannying about, so I range traded a small number then left it. I don't enjoy that, esp on this platform.
 
Sponsored Links
Ok lets have a look at
14:39​
Marathon Digital Holdings Inc (All Sessions)
4​
1966.9​
1943.3​
-£94.40​
11/07/2024 14:37​
14:14​
I'm not sure what the times are, there seem to be too many, but I think you were in the trade between the yellow verticals:


So the price popped up, for no clear reason. That sort of thing happens off the open. Brian Shannon was on, saying he doesn't trade the open, it's too random. You can be lucky, but it's a bit of a lottery. There was what looks like a bull flag, It's one of those "fakeout"s, so bad luck. It's an unusual shape for that though. Did you think you were buying on a pullback? I can see that. You were a bit heavy for a circumspect trade, If you'd been lighter you could have held on for the next top, and got 19.68..
So theere's a couple of reasons to be suspicious.

In fact once you'd seen that tall red revesal candle, short would have been just as justifiable. Hmm, wait for better quality entries?


here you entered short at price 1964, where the line is I think
1720748505983.png


Again, there was a peak - but a range hadn't developed. There was a bit of a level. You got out as the price was going basically sideways, but down a little, yes? Patience! If you'd waited it would have taken you down 75 cents for a decent win.
I wouldn't have entered, I'd wait for a better entry.


The Amazon 54.50 looks OK, but you closed when the price popped up at 15:03. OK, but then it went on down, 2 minutes late you must have gone for a cuppa?

1720749279859.png
 

Attachments

  • 1720746839914.png
    1720746839914.png
    120.4 KB · Views: 29
@Arbu Now, have you been learning? If so, I won't have to say look at bitcoin today and then Mara.

Edit
Having looked around, I don't think there was any particularly good reason that BTC ralllied. But now Trump got shot the boost to his campaign is expected to push it higher. Monday may be good.


In other news, a new LaNiña is on the way. That may hit EM bond returns, but bodes well for the likes of Home Depot which benefits from sales of ply and the like in the hurricanes.
 
Last edited:
The correction is on us.
A lot is being caused by what Trump says.
Some stock I hold dropped sharply today, but it's relative - about a 4% loss on one was the max, there will be more tomorrow. That one (LLY) actually dropped for a different reason than the general one, but it has gone up 50+% since January.

Investment advice - don't do it now, wait and see what happens. It's possible that things will be flat for a long time.
Or everything could drop 30% or more in some sectors.. By traditional standards, many company valuations are illogical.

Bitcoin may be jumpy, but you can only use that if you're sitting in front of a screen.

Safest plan is to sell everything now, and put it in 5% funds.. If you wait to see what happens, and it's bad, you will be too late. -30%?
If you sell and it turns out to be wrong, it might cost you a couple or a few percent
 
Last edited:
Sponsored Links
Some stock I had in Eli Lilly (pharma) went wrong. Someone else (Roche) brought out a better version of one of LLYs drugs. The stock plummeted. There was a cock-up over a stop-loss so I'm down £8k or so. Annoying, but in the scale of things, never mind. I'll see if it goes back again.


Looking at the political unrest we have now and what happened last year:
1721336433380.png


I'll sit it out until later.
Had a good year. Day trading you can win on a falling market, so I'll still be doing some of that, but investments will be in bonds and fixed interest.
Some of the hybrid bond/cash funds did OK, so I'll see what survived that period last year intact.

I'm holding a lump in India which has been steadily positive, and watching Japan and China, but will probably pull it all.
Long term fixed high savings rates would be sensible to adopt now, but too boring for me, I'll keep the options open.

@Arbu did you put it all down to history?

---

Here are some funds...
1721338267603.png

1721338318395.png

So I'll be looking at India yellow and the grey one, a particular Corp Bond.
The long-term stuff has been in the tech and Indian funds most of the time, and a money market fund in patches.
 
Last edited:
Bitcoin (etc) is obviously not the regular stock market.

Same old same old
See if it's moving in the premarket (Bitcoin market is 24 hour)
See if any of the half dozen related stocks are moving in the premarket.
If there's a concensus, they usually move all day in the same direction.
The related stocks move faster than bitcoin itself.
Or see if they decide to when the US market opens (14:30) <<------- nothing much happened until here today

Have some cash ready - as much or as little as you want.
Buy the stock - slowly if you like.
You can set a price-ratchet (TLS), alerts to your phone, etc
then let it run.
NB it's not a horse race. If the price doesn't move, you still have your 99% or so of your money.
1721413027331.png

20% easy - 25% if you were paying attention. Try harder and you can make it a much higher multiple. ANd not pay tax.
Any broker will do.

Dropping is just as good as rising.
** Practice with a demo account - not real money.
 
Last edited:
@kingandy2nd I've noticed you visit sometimes. Do you indulge?
If not, you could. You'd need to learn a bit more than you'd need to know,
choose some simple rules, and execute said rules. Start with a demo account and you're risking nothing.
 
@kingandy2nd I've noticed you visit sometimes. Do you indulge?
If not, you could. You'd need to learn a bit more than you'd need to know,
choose some simple rules, and execute said rules. Start with a demo account and you're risking nothing.
I keep dipping into the thread, but to be honest I need to sit down and read from the beginning as I don’t understand enough about it all to know what to look for and what to do.

I am interested in dabbling, but I know you need to commit time to this to maximise the opportunities.

I do enjoy following along with your activities and those of Arbu.
There are many quick intros. It's worth looking at what's on youtube as introductions. Some are crap but help set the stage.
"All" you need is some reasons why a stock might go in a particular direction. If you get several reasons, then you're more likely to be right than wrong. Maybe 2 times out of 3. Say if you're right you make 30%, and if you're wrong you lose 10% because you abort.
In 12 trades you'd have 4 losers and 8 winners. 1 x 0.9 x 0.9 x 0.9 x 0.9 x 1.3 x 1.3 x 1.3 x 1.3 x 1.3 x 1.3 x 1.3 x 1.3 = x5.35
If you get 1/3 correct, it's x1.23
And so on,


There's a course at "statsedge trading" by an honest, straightforward and successful guy named Michael Nauss. He's made a ton of money doing what HE does which has been analysing chart patterns and investing. Very successfully he sells very good lumps of software for people "swing" trading, which is spotting buy and sell opportunities over a couple of days to a month. That may be the direction which you would find best, but you wouldn't buy into the $$$$ pro stuff unless you want to get serious. Use a new email address for trading - it may get bombarded.
[The sort of thing he does - an example I used - he tracks all the stock sectors, of which there are 11 major, and a ton of minors.
He noticed that "transport" had gone up 5% in the last week and was still rising but one of the couriers hadn't (DPD or DHL or...). He looked at the stuff he knows to look at, and saw no reason for the exclusion. He'd bought it. I bought £2000, it went to 2160 in about 3 days, so I sold it. Doesn't sound much but that's 1.08^(50 weeks x 5 days)/3 = 600% pa.]
There are lots of niches When you refine something so it works, that's called an "edge".

It depends what time you have. I know an accountancy lecturer who has a method which looks at a particular foreign currency "indicator" once every 2 hours. If it's positive he buys. Some people look once a day, or a deep look once a week, etc. Nobody's going to tell you whatto buy now to makt 100% tomorrow. WHen those come up, everyone else will be in ahead of you, and your price will be AFTER it's gone up.

An intro course will tell you a lot about 'volatility', the 'spread', 'levels', and 'trends' and 'pullbacks' and 'volume', then looking at different time frames and candle patterns etc. None of them is hard at all. It's enough to win on average. People do it all the time....
 
Thanks Justin, I appreciate the info/details you’ve provided. I think that’s part of the problem, there’s so many dud advisors /advertisers out there it’s hard to know what to look at and trust.

Might be one of these things where it would be good to meet up and I’ll buy you lunch or dinner so we can chat and absorb a bit of knowledge from someone that clearly knows what they doing :)
 
Small matter of a few million miles in between....

You know, the duds are pretty obvious, you'll see them clearly. Often they're selling how to get rich tomorrow. Ignore those. Have a look at those stats edge lessons - just dip into a few to see what sort of thing he's on about. You need almost none of it, but that's what it's about.
Here are "instructions" https://www.etoro.com/trading/day-trading/

What you gotta do is buy low sell high. (unless you plan to go the other way!) SImple, huh, you just need something which is moving up...
A small snag is the cost of dealing, but you can minimise it.
Right now the "names" which have been skyrocketing are all over the place. Partly due to Trump, Crowdstrike, Taiwan, all sorts.

Suggestion - open an account somewhere free, which means Etoro or Trading 212 or Freetrade. (there's also Saxo, Capital, CMC and on...) I have used the first 2. T212 mostly.
Do almost nothing, except on the Demo platform. You don't have to deposit any money at all.

But you can put £100 in and play with it & watch.
Right now, everyone thinks corrections and whatnot are on the cards - they've started of course.
Avoid stocks right now - see below:

This is like a bond, it's overnight money market, UK (CSH2)
1 Year 5.2%
1721517657868.png

That's what you call "Non volatile"!

"normally", the gains are in the stcocks. Groups of stocks are called Funds or ETFs, typically.

My savings are at 6 different places for anything over the FSCS limit. They all have different funds. Funds are different types, without getting complicated they're made up from a number, can be into hundreds, of stocks the Manager choses, or an Index. So you reduce the jumpiness by using a fund. A lot use the S & P 500, which over time does well, they're the TOP 500 US companies.

6 times better, but join at the wrong time you'd have dropped a lot at first. You want to watch it drop, then buy when it turns green.(Indicators help)(S & P 500)
1721518174389.png


If you're more "bullish" you may plump for the tech sector (XLK) which has "won" for years:
1721518440731.png

That's 10 times better than the bld soc, but look what just happened. Ouch.

-
If you watch regularly, you can use say, only SEMICONDUCTORS: SMH x3
1721519095963.png

For a 50 - 60x times building society rate

And if you're afkin addict like wot I am you BEAT this single stock: Nvidia x3, the biggest n baddest chip company.
1721519764774.png

Which went 250+ times the building society, so you could have just jumped in for a short while to do well.

I wouldn't invest in that today. It has dropped 40% in a couple of weeks.
There Are Bonds .. Those are repayments on loans. A few types...... government ones etc up to ~5%, but also many are less good quality but the rates are better. You can look at the history to see how they've done. I've seen some odd step changes but they seem rare.
With bonds you have to search. Not all bonds are on all platforms:

The only bond worth using on T212 at the moment is probably IUSQ, but barely. There are good bonds on other platforms. ( A couple from MAN, but not EToro either.
 
Right now I'm comparing things to see which did ok both last summer when the market did nothing much, and when it dipped later. (May this year.)
Anything to do with equities more or less mirrored the tech sector, and also dipped. So looking among corporate bonds
(Using Hargreaves Landsdown because they have good charts to compare with)
The top one is global tech, up 100% in 18 months but currently showing a considerable drop, which may well continue,
1721574022134.png


Taking out that top one leaves this (it logged out so slightly different)
1721575096309.png

The green one Man GLG Sterling Corp Bond looks to be a good choice now.
Not only has it not reacted to the tech stocks'
variations, but it was OK during July-Sept-Oct time last year when the market was generally flat.
The orange one would do as well, it was lower but parallel.


---
Speaking of "dabbling" it's always worth having a look to see if there's some stock doing something bonkers like AberCrombie and Fitch did. If it has done it for a month or three, then it probably won't stop tomorrow:
I wasn't looking so didn't see this one, but it was getting mentioned. A buy any time over several months would have done well. I didn't take notice until the little red arrow unfortunately :( which was annoying, but got back in over the yellow line period up to "results". It was up about 45% in a month.

There were others, including Rolls Royce and Rheinmetall (German tank maker).
Also some commodities like Cocoa, and Copper
There have been some "meme" stocks of crazy prices with little value, like "Gamestop" it's best to avoid. A quick Google will reveal all.

Nothing behaving of those at the moment - AFAIK - you can't catch em all.

If anyone finds something special do let me know!
 
Nasty day today, no real trends. Made a few small mixed trades and then just watched.
Tesla, Google Results weren't good. Further of same coming, may well promote a general drop in very few weeks.
 
I was thinking of the desire for "dabbling" the other day.
You only need to know a little bit, to be ok doing that.
Even when there are mo l;arge swings in the markey going on which you can join in with.

The way the prices move is highly repetitive, in a lot of different "modes". You have to recognise which mode is useful at a particular time.
Imagine a huge sheet of metal dangled by one corner. People whack it with hammers from time to time, then it rings and vibrates and swings at all sorts of frequencies which come snd go without anyone doing anything.
The markets is largely controlled by "bots".
A price goes up. That's attractive for making money so the bots invest, which pushes the price higher. Then the bots' algorithms tell it that the price s high enough so it sells. So the price falls. That's not just an "out of the market" sell, it's what's called a "short", a position which profits when the price goes down.
[Think that you borrow a share when its price is £100 and sell it for £100. The if the price drops, you replace the share, when the price is £90. You made a tenner.]

So without any exterior influence, the prices go up and down. They do it in "ranges" or "channels" say between £100 and 110. If the "spread" (the buy-sell price difference) is £1, then once you've sussed the pattern, you can buy (going "long") and/or sell atthe appropriate times to make, say £7 a time, allowing a margin. Often you can win on 3 or 4 rises and falls before the pattern changes and you cut it short. So you might win £25 then lose £5. If the pattern changes and you're ready for it, you do better.

Prices do not go in ranges all day. One tactic is to watch several charts (shares/funds/indices etc) at once until you find one which is doing it, and use that. They're common towards the end of the day when there hasn't been any particular news.

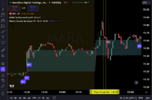
Here's one I used the other day:
You can see the price was in a slowly rising channel
goodwaves.png

The bottoms were about 172.40. I picked it up at the dip at 17:30.(time axis).
I watched for the wicks becoming the same height, where the bottom of the "L" of "GOOGL" is.
You get used to picking the tops and bottoms, from the wick extremes. Though sometimes they catch you out a bit.
The next peak wasn't as high, but showed the same topping appearance, so fine, I got out there.
The bottoms were easy to spottoo, see? The price jumps about so you hit the button best you can.
The next peak stopped half way up, so I held, ready to get out if the price dropped but it went on up.
There were two tallgreen candles which suggetsed a reverse (same as the ones above the "00" of 17:00 so I sold.
Two minutes later it was clear the price was going on up so I bought again until it got to here.

What do you think is going to happen next?
The price has curled over again, looks like it's going flat, see? So I sold.
(You get the "bid" price, here 173.66. If you bought atthis point you'd pay 173.70, the difference is the spread:)

goodwaves2.png


The next couple of cndles went a little higher, but where I sold was fine.
That wiggly red line is an "indicator" where things can change, so I didn't get involved until it made a new recognizable pattern.


goodwaves.3png.png


If you look at the prices you can see that if you owned one share you wouldn't make much. I checked, it was $2.43 of share price over the whole period with some "longs" and some "shorts".

You don't use that little, when you're not learning any more (when learning use $0, in a simulator).
Ifyou used say $1000 in a pot, in a platform where you can routinely leverage at 5x, you're effectively using $5000.
One way to work that out is 5000/173 = 29 shares so you'd make 29 x £2.43 = $70 approx.
If you used $10k you'd have made $700, $100k would have made $7000, etc.
To improve your chances of NOT getting caught, wait until the direction you want is established (by one candle, say). That reduces your profit per swing, ok.
To improve your chances more, you look for the TREND, which here is slightly UP. Then you ONLY use the rising parts of the wave. The advantage there is that if you cock it up for some reason or there's a twitch, you can usually just WAIT, and the price will come up for you.


That simple ploy would usually see you OK.

Here's an up-channel over a much longer period (everything's "fractal" - same patterns over all periods)
Persimmon since STarmer. WIth this sort of thing if you get out when theres a red and buy again when there's a couple of greens, it works nearly all the time. It was only half a dozen interactions but a lot of watching. The channel lines are not meant to be particularly accurate, but you can see they're narrowing. It will peak very soon if it hasn't already. I've sold most of mine late Friday, expecting a dip then dunno on Monday.

1722137675289.png


NB this gave near 20% . If you use leverage of 5x that means you doubled your money, but less a bit due to overnight fees, perhaps 2% off the 100%.
If you double your money every month, a 20k investment becomes 4096x =~ 82M in a year.
You don't always get it right.
 
Last edited:
Ok lets have a look at

I'm not sure what the times are, there seem to be too many, but I think you were in the trade between the yellow verticals:


So the price popped up, for no clear reason. That sort of thing happens off the open. Brian Shannon was on, saying he doesn't trade the open, it's too random. You can be lucky, but it's a bit of a lottery. There was what looks like a bull flag, It's one of those "fakeout"s, so bad luck. It's an unusual shape for that though. Did you think you were buying on a pullback? I can see that. You were a bit heavy for a circumspect trade, If you'd been lighter you could have held on for the next top, and got 19.68..
So theere's a couple of reasons to be suspicious.

In fact once you'd seen that tall red revesal candle, short would have been just as justifiable. Hmm, wait for better quality entries?


here you entered short at price 1964, where the line is I think
View attachment 348702

Again, there was a peak - but a range hadn't developed. There was a bit of a level. You got out as the price was going basically sideways, but down a little, yes? Patience! If you'd waited it would have taken you down 75 cents for a decent win.
I wouldn't have entered, I'd wait for a better entry.


The Amazon 54.50 looks OK, but you closed when the price popped up at 15:03. OK, but then it went on down, 2 minutes late you must have gone for a cuppa?

View attachment 348703
The entry and exit times for each trade are the first items for it, before the stock name. Sorry, the formatting is confusing.
Yes, the first one did show a big red reversal candle. I didn't wait for it to develop, but thought I was getting in on a pullback. You're right I should have waited more.
The second trade you refer to, the short, was from 15:42 to 15:49. I think I had been waiting to go short, as it looked like a range was forming. The 15:41 one minute candle looked very bearish, so that's probably what persuaded me to get in.
The Amazon trade was from 14:27 to 14:55. Clearly it would have been better if I'd stayed in longer. Perhaps I focus too closely on the trades, and that makes me get out on minor things?
 
Sponsored Links
Back
Top