Stock market dealing

13/08/2024​
QUALCOMM Inc (All Sessions)DFB
£86.50​
16508​
16681​
0.5​
2024-08-13T16:17:432024-08-13T14:09:02
13/08/2024​
Microsoft Corp (All Sessions)DFB
£42.50​
41184​
41269​
0.5​
2024-08-13T15:37:042024-08-13T13:54:52
13/08/2024​
Uber Technologies Inc (All Sessions)DFB
-£53.00​
7004​
6951​
1​
2024-08-13T15:01:352024-08-13T14:30:05
13/08/2024​
Taiwan Semiconductor Manufacturing Co Ltd - ADR (All Sessions)DFB
-£61.50​
16777​
16900​
-0.5​
2024-08-13T14:47:102024-08-13T13:51:48
£14.50​
Not much time and I only have 10 min chart for the 8th
1723584301341.png


YOu went short on aboutthe yellow dashed line.
Tell me, is that an uptrend or a downtrend.
HInt: you got it wrong.
Can't see in those candles how you came aut at 169 coming out tthe pinkish time, but surely the penny dropped that you'd got the direction wrong?
If you'd simply gone long in there, at say $158 and done nothing all day, you'd have come out at $165
$7 at $0.5 a cent is $350, right??

Why didn't you do that? It was UP for 7 x 10 min candles after you left.
 
Sponsored Links
Not much time and I only have 10 min chart for the 8th
View attachment 352134

YOu went short on aboutthe yellow dashed line.
Tell me, is that an uptrend or a downtrend.
HInt: you got it wrong.
Can't see in those candles how you came aut at 169 coming out tthe pinkish time, but surely the penny dropped that you'd got the direction wrong?
If you'd simply gone long in there, at say $158 and done nothing all day, you'd have come out at $165
$7 at $0.5 a cent is $350, right??

Why didn't you do that? It was UP for 7 x 10 min candles after you left.
The trade was today, 13th August, not 8th. Note also that the times are GMT so you have to add an hour to get BST.
 
14/08/2024​
Amazon.com Inc (All Sessions)DFB
£6.74​
17062​
17048.53​
-0.5​
2024-08-14T15:42:352024-08-14T14:07:25
14/08/2024​
Taiwan Semiconductor Manufacturing Co Ltd - ADR (All Sessions)DFB
-£92.15​
16793​
16977.3​
-0.5​
2024-08-14T15:33:542024-08-14T14:41:39
14/08/2024​
Carvana CompanyDFB
-£56.50​
14318​
14431​
-0.5​
2024-08-14T15:16:252024-08-14T14:24:13
14/08/2024​
Marathon Digital Holdings Inc (All Sessions)DFB
-£66.40​
1527.7​
1544.3​
-4​
2024-08-14T14:34:342024-08-14T13:51:16
14/08/2024​
Uber Technologies Inc (All Sessions)DFB
£14.00​
7090​
7076​
-1​
2024-08-14T14:15:252024-08-14T13:54:28
-£194.31​
 
I misread the date format . Stick your own screenshots up, with correct times, if you're after comments!

If tis one's right
1723768504456.png


It's mad! Long yes, but you'd hold it longer. Must be wrong surely???

Gawd, make it simpler, stop hopping about.
Today.... I have a S&S Isa with 20 odd k in it. No leveraging in there but you can use leveraged stocks.
Bitcoin wasn't doing much.
I looked at the Nasdaq premarket. You can apply filters for market cap etc, and download it as a csv so you can sort it in Excel.
NVIDIA was getting up.
When the market opened, NVIDIA was rising after a dip so I put 9k in NVD3
Also, ASTS which was one I'd written down in the premarket with news of some sort which I remember from before, was rising, so I stuck 9K in that.
I didn't expect Nvidia to go much above recent highs
NVD3 went up 11% by the end of play in UK,and ASTS was going into orbit. At some point I switched across to ASTS.
11% would have been absolutely fine, but with ASTS it came to a lot more, the bloody thing went up over 50%. Total gain over 7k.

I'll let you work out what the CFD platform made.

NVIDIA results are due in a couple of weeks, so it'll be mad.

A witch doctor says stocks will drop on the 20th next week. We'll see.
I've just reloaded long-term ££ into tech, so I may take half out in case he's right. He often is...
 
Last edited:
Sponsored Links
The trend was down so I went short, as you would have advised. Strange that you think I went long.
 
No, I said it was mad to go short. Because there was no downtrend. I didn't say you went long, though I would have done.
Why on earth you stayed in the trade so long when it was obviously wrong, I can't imagine. That's self-harm!

The price is falling off the open, leveling out to a level yellow, established in the previous 3 days yellow, with the wicks all approximately lining up at the same level blue, , and you think it's going to go on down? Really?? If so you should stop trading with real money.

1723841468494.png


A price doing that will either bounce like it did, or consolidate around the level.
You would have learned that in the first few days of trading, so no "oh but you said" .
 
A new theme -
Investing: What's hot?
This is to track my "opportunity" investing ideas. I'll say what I'm using and update it.
It is not investment advice.

Dibbling around making £X a day is all very well, but the time comes when the Xs add up to £Y.
£Y left alone can jump about in value by as much or more than X, so it makes sense to devote effort to tend to it.

Enter the stock screener, where you can look to se what has done well. A Heat Map is an easy thing to look at - see there are Sectors, like healthcare etc, within it EG HERE
The trouble is, it changes all the time, and previous peformance doesn't guarantee future performance.

If you go too narrow, down to one stock, it can buck the mini trend - if for example one drug maker's product is found to give you cancer.
Stocks are lumped together into funds called ETFs. You can screen for those too, such as
HERE , where there are lots of things to click.

Broadly, if something has done well in the last week, month, 3 months, 6 & 12, it's likely to carry on.

How agile you can be depends on your inclination and the platform you're using.
Inclination => time, reading, and setting things.

Platforms have delays, different ranges of ETFs and/or stocks, and other types of more or less managed funds such as OEICS.
OEICS are the sort of things you find pension funds using, which have a manager who actively changes the stocks which make up the Fund. There can be dozens or more.

The easiest thing to do, is get it all wrong.
As an example, Bitcoin. It makes the news when it's high. Say it's 20% up.
So you think you'll be in with the in set, and buy bitcoin at 120.
But the price is already at the peak, by the time you've heard about it and gone through the buying mechanics.
It might rise another 2%, but then it flattens or falls back a few percent and is falling slowly.
So, dischuffed, you sell before it gets lower, at 115.
Then there's Copper doing well, so you buy copper for a similar cycle and you end up at 110. Oh dear.

One collects the T shirts.

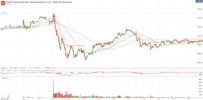
A simple rule, using the knowledge from above, is go for what's stong, but don't buy at the top, buy the dip, when it's rising, as long as the dip looks ordinary. I've shown several rising trends but here's a random one. Tesco. Draw the red and green lines to help - or the chart tools will do it for you as here. Buy at blue or preferably green line. If you're unlucky as at the arrow, you're in an uptrend so hold on and it'll come right - almost always.
1723913161748.png


But back to investing. I use a small number of ETFs and funds.
From this which I posted recently I've used Semicionductors, Global technology( ), India( has been 50% ) , Corporate bond (28%), Money Market (5%), and Japan.
Lessons I've learned are to sell the exciting if the price is going flat and the "gossip" is downbeat. That's from Bloomerg, CNBC and a couple of others.
I have switched for safety to a corporate bond, mostly, which will tick over at well above 5%. One or two percent per month is fine. Some platforms only have lower rate corp bonds.
Reacting to what's rising, if there's something suitable and if you can do it in time, can pay well.

---

A couple of weeks ago I decided to use a dedicated amount for "opportunity" stocks when I find them.
I shall record the ongoing progress as a percentage
That's what prompted this post.
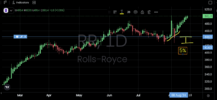
1) NVIDIA is the poster boy chip stock. Results are due in a week or so and are likely to be exceptional, so the stock is rising as people "get in".
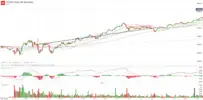
2) Japan's stocks started to rise. All about the Yen etc
In both these cases I'm joining the trend, they don't dip much. So buy a little , buy a bit more iif the price is about flat or falls, so you get an average price. If the price drops you haven't lost much.

If I'm physically watching, and the price is falling, I'll still only sell if I'm going to be around to rebuy at a lower price. Experience shows it's often better to hold on, because I miss the best times to rebuy. The "Spread" is another factor, the Buy price is higher than the Sell price, always. If you sell and rebuy at the same price it'll cost you the spread which can be 1% or so if it's wide.

You could just do the buying/selling once a day, or once a week; you adjust your time frames.
These had been rising a while, but I started last Monday 12th Aug. I'll "normalise" to a £1000 start. (Wk#33)
2/3rd in NVD3 start of week 3000, end 4464, + 53.75%
1/3rd in 3JPN start of week 800, end 919 , + 16%
which gives £1412 , 41%.
I'm aiming to adjust this on a several-day basis, only.
I'll see how it looks Monday a.m. and probably keep the same funds for this. I expect it to be a rocky ride. Could be a disaaaaaster dahling!

For most of Passing Billions I can't act quickly. I'm using, for ISA and non Isa accounts, a "free" day- trading platform which has no "OEICS", Hargreaves Lansdown which is fairly quick to change and has a fair range of funds, a couple of banks which are less good for the range. I should combine things in to Interactive investor, Invest Engine, Fidelity, etc. (Some have higher fees but a wider range of funds. If you find something niche doing well (say Japanese electronics ) it can overwhelm any fees).

At the moment for long-term stuff I'm using a mix or Money market(5% - %25 as avilable) corporate bonds, and bringing some Tech back, with in a couple of cases Japan. Single stocks like NVIDIA , and especially leveraged ones, are often not available on fund platforms, or have silly dealing charges like £30 online, £50 by phone. OK if it's for a larger amount of course.

A guru says tech stocks will drop Tuesday - we'll see!
 
Are you guys working to an investment strategy with loss limits?

From my research 80% of retail traders lose money because they don’t have a clear trading strategy or don’t stick to it.

I’m thinking of dabbling, but I’m thinking of picking a few stocks with smallish amounts to have a play and stick the bulk in a Vanguard investment trust
 
I am an investor, not a trader, and made a very satisfactory gain over the last 12 months, mostly by sitting on my srse.
 
Who is this witch doctor and guru? Can't you say?
Bloke called Andrew Rader. "Rader Trader" Only 20 but ..
Are you guys working to an investment strategy with loss limits?
Errm, I don't want to sound like a politician but can't answer yes or no.
Strategy - buy low sell high, works. After that it gets complicated. Ripples in a price are expected. You can avoid all but the tiniest if you want, but that;```s a lot of effort. If a stock is going down, you would want to sell it if you could (and can manage/remember to keep eyes-on) catch it on the rise again and not lose in the transaction costs.
If a stock is in a pattern of rising three and falling one, you could just leave it, or put effort in to not losing the "one"s..
Most aren't that regular, eg Rolls Royce
This illustrates a "strategy" I try to adopt:
There was some good news in February so I bought some. As it's going up, I don't have a stop -loss set under it. You can see enough short-lived spikes under the candles which would "stop me out" for a loss, when the price would almost immediately come back up again. So I have a stop-sell running above the current price, which catches the odd short term jump up and sells 30% or so.
I sold around the red circle and waited. There would be no point holding a loss - I think there was a Downgrade. Those come out of banks etc.
I rebought at the dotty yellow line, early August. The price shot up for a while ( a day), so I sold in the yellow oval when it started to dip again.
I rebought when it was heading up to the previous level. Levels are important. It was at 1988.
It blipped and dipped a bit but now it's at 2750. Its AT the previous high level, 2755 ish, so I probably ought to have sold it to see what happens.
It's up 38% in 5 trading days which could be a fragile rise.
Level tend to be bouncy or sticky, for prices.
1724014876077.png

If you "invested" in late June and "sat on your srse" you would have lost a quarter, whereas the fairly infrequent interventions I've made in the past half year have seen a rise of nearly 3x. Could it lose 5 or 10% before I could get to it? Sure - no worries. If you apply more intelligence to it than sitting..... you can judge whether it would be likely to spring back up.
It's not a great rise in comparison with some of the tech stocks over the same period, so should I even hold it? Dunno. I only have a few k and , well, it's Britishish.

From my research 80% of retail traders lose money because they don’t have a clear trading strategy or don’t stick to it.
Sure. If you played poker without bothering to look up the odds for the different hands, you'd lose to someone who had.
That's a kind way of putting it.
There is an example in this thread Our friend arbu has a record of doing things which a little k and i would tell you , would be likely to lose.
Look at that graph in #651 . That's to me a stupefyingly inappropriate place (blue circle) to go "short" ,= profiting on price falling. Going long having seen the error, would have seen good rises, but he chose not to. This is what people in the 80%, do.
I have repeated many times the tactics I use on day trading. The weekly effect was generally 2x or more, using a standard 5x leveraged platform. I keep reusing the same stake, shaving the top off. The shave-off now dwarfs the original pot. If I had let more compound, (which wouldn't have been uncomplicated) life could be more complicated. The tactic is less effective now that bitcoin is less volatile. Rising or falling = profit.

in a Vanguard investment trust

You might be better using a mutual fund. You pay more for da management, like 1.5%, but your return should be better. Traditionally the minimum sum was an issue, I'm not sure now.
I would urge you to look at some prevous performances. The Hargreaves Lansdown sit lets you superpose the traces. US outperforms the R of the W. Tech over time beats the S&P500 but the dips can be deeper. India, or Japan, or one day China, will outdo the USA. Pick a platform where you have a choice. Buy when they're rising and look once a week. Sell when they go flat (or dip). Look atthose funds I documented - the MAN GLG Stlg Corporate Bond and Jupiter India. India is flattish, let's see if it picks up. S&P 500 is more likely to dip short term. L&G global Technology is OK and on many platforms. Indirectly here, I'm recommending Hargreaves L. Watch the fund bying fees for smaller amounts though.
Trading 212 gives you 5.2% in ninvested cash, but they don't have the range of funds.

I am an investor, not a trader, and made a very satisfactory gain over the last 12 months, mostly by sitting on my srse.
Do you think the former term more worthy, or what? Trading and investng are both about financial gain, only the period is different (discuss..?)
Do tell what vehicle you use and the result. What to you is "satisfactory"?


---
XPENG will be down in the morning. Look for sympathies (other Chinese EVs) and rebounds.
Nikkei started down but has bounced as you'd expect from that big bottomming candle, that's nice, 0.5% and I'm out. 10k x(0.5% x 5) = £250 for sitting .... ____answering the post...
1724026982469.png

US leaning up, so hopefully chips will be up.
Jackson's Hole is causing twitches
 

Attachments

  • 1724013729130.png
    1724013729130.png
    81.6 KB · Views: 12
Last edited:
Because there was no downtrend.
There was. Lower lows and lower highs. As per your definition. Maybe the one minute graph is the wrong period to look for them on? But you have also said to look at what the markets are doing on a given day, find a moment to get in, and follow it. So then I'm only looking at the first hour or so of trading, and there will never be a trend on that timescale using the 5 minute chart and your definition, so it won't be possible to make a conclusion about what the markets are doing on that day.
 

Attachments

  • Taiwan Semiconductor Manufacturing Co Ltd - ADR (All Sessions)_20240819_13.43.png
    Taiwan Semiconductor Manufacturing Co Ltd - ADR (All Sessions)_20240819_13.43.png
    261.4 KB · Views: 15
19/08/2024​
NVIDIA Corp (All Sessions)
£70.45​
12508​
12648.9​
0.5​
2024-08-19T16:34:342024-08-19T14:00:31
19/08/2024​
NVIDIA Corp (All Sessions)
£90.00​
12508​
12688​
0.5​
2024-08-19T16:31:092024-08-19T14:00:31
19/08/2024​
Alphabet Inc - A (All Sessions)
-£3.40​
16517​
16513.6​
1​
2024-08-19T15:39:352024-08-19T14:03:45
 
There was. Lower lows and lower highs. As per your definition. Maybe the one minute graph is the wrong period to look for them on? But you have also said to look at what the markets are doing on a given day, find a moment to get in, and follow it. So then I'm only looking at the first hour or so of trading, and there will never be a trend on that timescale using the 5 minute chart and your definition, so it won't be possible to make a conclusion about what the markets are doing on that day.
No.
You're doing it again - that's all your usual crap and sorry, but you're being a jerk.

Cars have wheels. Not everything with wheels is a car.
It's the same thing as before - like someone says watch out for cars and a bus runs you over so you blame them because you were a good boy and you did look out for cars. To be a victim??
You need to learn for yourself. You're frankly being infantile about it, and you aren't kidding anyone. You've been trading years and you claim you don't know what a trend is. You have illustrated books which show you. There are websites and youtubes, all sorts. It isn't tenable to try to blame me, which means you're doing it on purpose.
It's impossible that you're as dense as you pretend to be. You have to look at everything, but no, you look, pick on one thing you can choose to interpret it in a stupid way, then sit in a losing trade for a few hundred quid. Being a victim I suppose?- god knows. Your problem not mine.
If you're really not pretending and are as dense as you're showing us, then give up now, you'll always lose. I don't believe it for a minute though.

You were lucky with those Nvidia trades. I looked at the 1 minute chart. You got in at the wrong place, and out just where you would have doubled the profit if you'd let it carry on or had re-entered after a couple of minutes - it was going up.

I expect you now to claim some big win in an attempt to prove you know what you're doing. I won't even look at it.

Nvidia will probably move about, up mostly, by 30% or so going into its earnings. Spread betting allows use high leverage.
Even half a buck a cent is x50, so with 10k that makes 150k or so.
 
I got into nvidia because it had started up and dipped back down, there was a longer term trend up, and it's so exciting that it's results are coming out soon. I got out because I had seen resistance in the orange line, and I had a trailing stop loss, as per your suggestion.

But I agree, it's all luck anyway, and these things that I looked at are of no consequence. At least I have the courage to post my trades unlike you and all the people on tradertv.

Today should be easy anyway, because we have your witch doctor to rely on.
 

Attachments

  • NVIDIA Corp (All Sessions)_20240820_11.44.png
    NVIDIA Corp (All Sessions)_20240820_11.44.png
    279.7 KB · Views: 12
Sponsored Links
Back
Top